


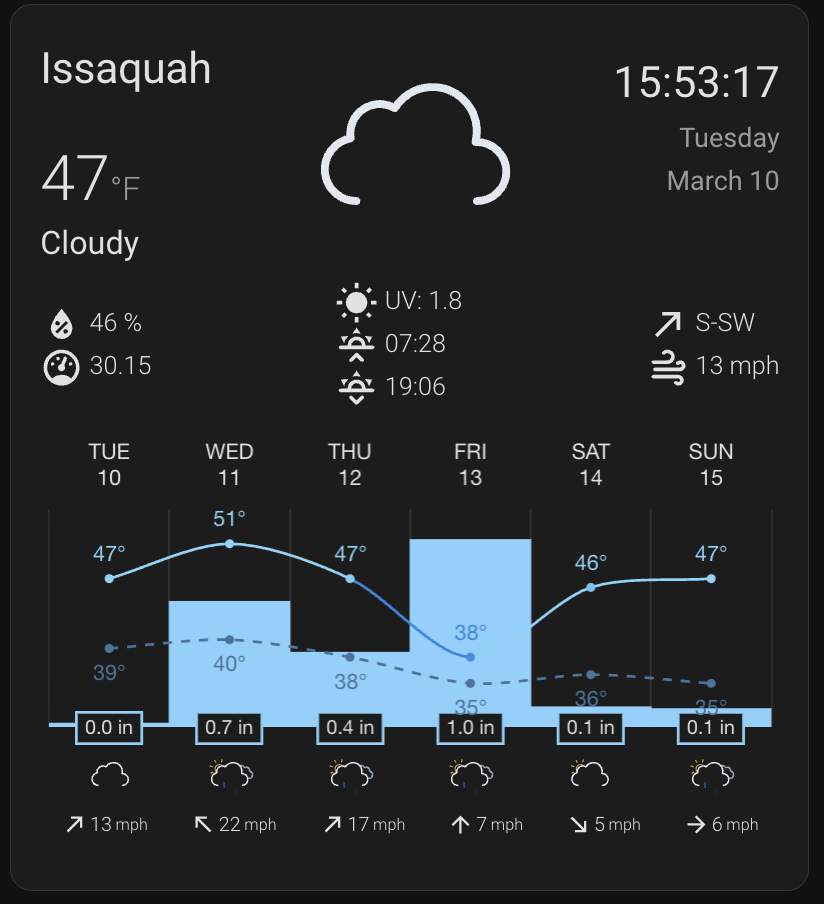
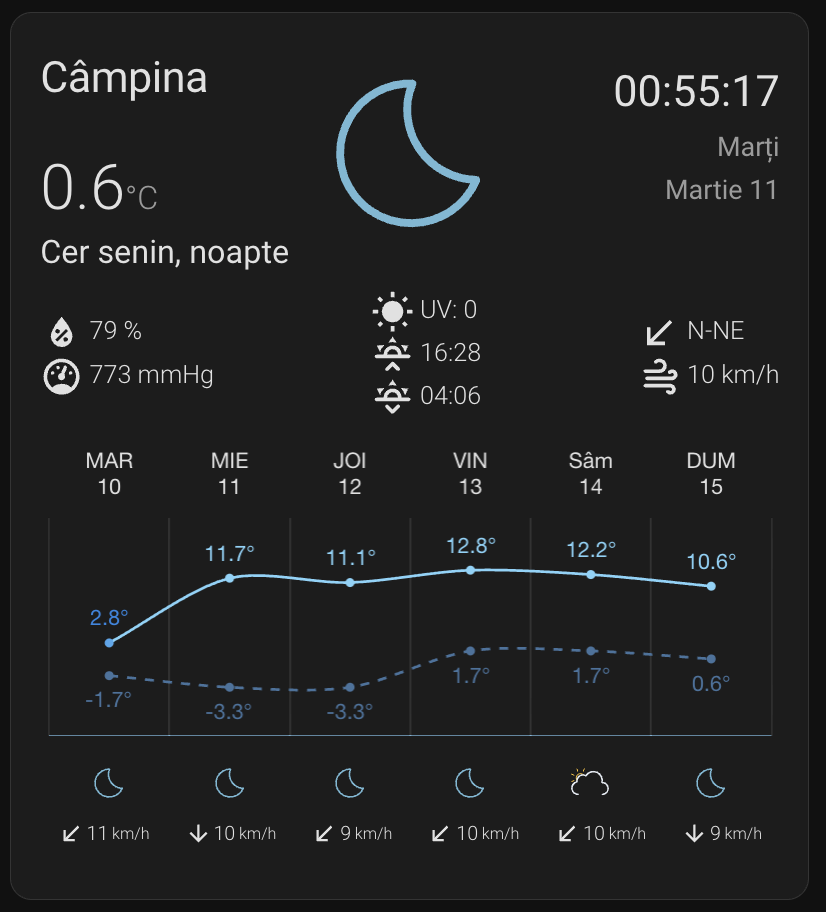
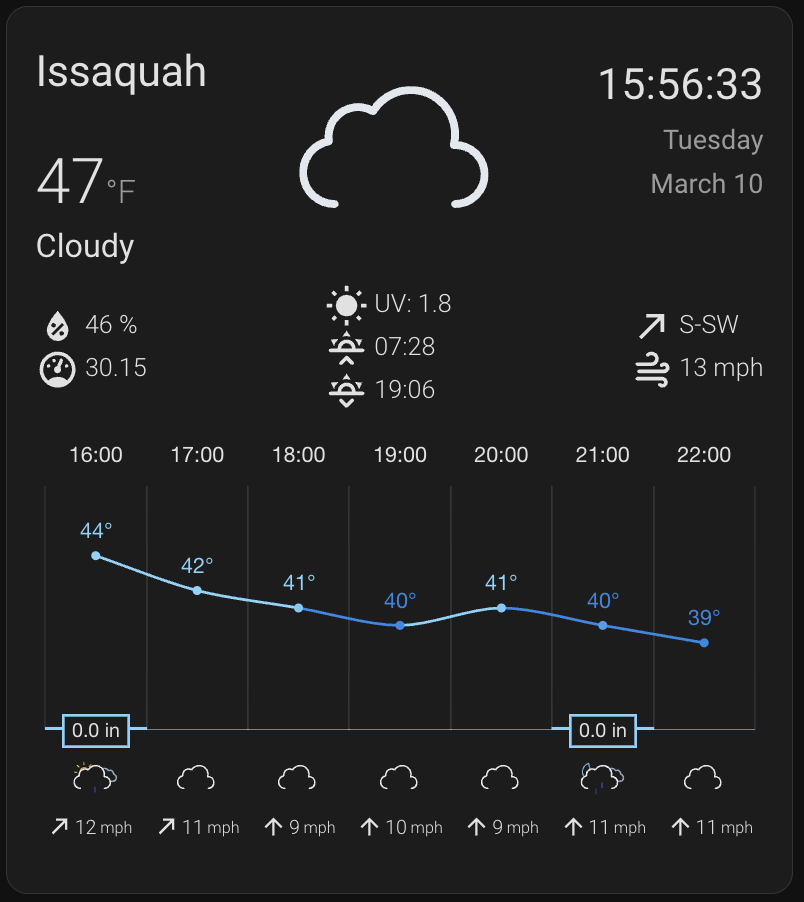
This is an actively maintained fork of the original weather-chart-card project by mlamberts78. We've added significant improvements including:
- � Daily/Hourly Toggle - Runtime button to switch between forecast types
- 🌡️ Enhanced Temperature Gradients - 6-level comfort-based color spectrum
- 🌙 Improved Day/Night Distinction - Dashed lines for night temperatures
- 📅 Date Labels - Show date numbers below day names
- 🌍 Advanced Timezone Support - Multi-location weather monitoring
- 🔄 Smart Unit Conversion - Automatic °F ↔ °C, inHg ↔ mmHg ↔ hPa
- 🎨 Customizable Layouts - Large weather icons, flexible positioning
- ⚡ Development Tools - Local test server for easy development
This version continues to receive updates and bug fixes to ensure compatibility with the latest Home Assistant releases.
- Daily/Hourly Toggle: Runtime toggle button to switch between daily and hourly forecasts
- Optional button that appears in the top-right corner (disabled by default)
- Seamlessly switches between forecast types without editing configuration
- Automatically checks entity support for the requested forecast type
- Temperature Gradient Colors: Automatic color-coded temperature lines based on comfort levels (6-level spectrum)
- High/day temperature line displays with gradient colors from cold (blue) to hot (red)
- Low/night temperature line displays as a dashed line in solid color for easy distinction
- Date Labels: Display date numbers below weekday labels in daily forecast view
- Enhanced Visual Design:
- Gradient colors based on actual temperature comfort: < 5°C (Cold/Dark Blue), 5-15°C (Cool/Light Blue), 15-22°C (Comfortable/Green), 22-26°C (Pleasant/Yellow), 26-32°C (Hot/Orange), > 32°C (Very Hot/Red)
- Dashed border for night temperature line for better visual distinction
- Solid border for day temperature line with gradient colors
- Customizable icon sizes with multiplier support (0.5x - 4x)
- Large centered main weather icon option
- Timezone Support: Display weather for multiple locations with proper timezone handling
- Development Tools: Local test server for easier development without Home Assistant installation
- Open HACS in Home Assistant
- Go to Frontend section
- Click "+ Explore & Download Repositories"
- Search for "Weather Chart Card"
- Click "Download"
- Restart Home Assistant
- Clear browser cache (Ctrl+Shift+R / Cmd+Shift+R)
- Download
weather-chart-card-ha.jsfrom the latest release - Copy the file to your
config/wwwfolder - Add the resource in Settings → Dashboards → Resources:
URL: /local/weather-chart-card-ha.js Type: JavaScript Module - Restart Home Assistant
- Clear browser cache
type: custom:weather-chart-card-ha
entity: weather.hometype: custom:weather-chart-card-ha
entity: weather.home
location_name: "Home"
timezone: "America/Los_Angeles"
show_time: true
show_day: true
show_date: true
animated_icons: true
icon_style: style1
icons_size: 20
forecast:
show_date_labels: true
condition_icon_size_multiplier: 2.0
use_color_thresholds: true
chart_height: 180
labels_font_size: 11
style: style1
units:
temperature: "°F"
pressure: "inHg"
speed: "mph"| Name | Type | Default | Description |
|---|---|---|---|
| type | string | Required | Should be custom:weather-chart-card-ha. |
| entity | string | Required | An entity_id with the weather domain. |
| location_name | string | none | Display name for the location. |
| timezone | string | none | Set a specific timezone (e.g., 'America/New_York'). Defaults to system timezone if not specified. |
| temp | string | none | An entity_id for a custom temperature sensor. |
| press | string | none | An entity_id for a custom pressure sensor. |
| humid | string | none | An entity_id for a custom humidity sensor. |
| uv | string | none | An entity_id for a custom UV index sensor. |
| winddir | string | none | An entity_id for a custom wind bearing sensor. Sensor should have value in degrees |
| windspeed | string | none | An entity_id for a custom wind speed sensor. |
| feels_like | string | none | An entity_id for a custom feels like temperature sensor. |
| dew_point | string | none | An entity_id for a custom dew point sensor. |
| wind_gust_speed | string | none | An entity_id for a custom wind gust speed sensor. |
| visibility | string | none | An entity_id for a custom visibility sensor. |
| description | string | none | An entity_id for a custom weather description sensor. |
| title | string | none | Card title. |
| show_main | boolean | true | Show or hide a section with current weather condition and temperature. |
| show_temperature | boolean | true | Show or hide the current temperature. |
| show_current_condition | boolean | true | Show or hide the current weather condition. |
| show_attributes | boolean | true | Show or hide a section with attributes such as pressure, humidity, wind direction and speed, etc. |
| show_sun | boolean | true | Show or hide the sunset information |
| show_time | boolean | false | Show or hide the current time on the card. |
| show_time_seconds | boolean | false | Show or hide seconds for the current time on the card. |
| show_day | boolean | false | Show or hide the current day on the card. (Only visible when show_time is true.) |
| show_date | boolean | false | Show or hide the current date the card. (Only visible when show_time is true.) |
| show_humidity | boolean | true | Show or hide humidity on the card. |
| show_pressure | boolean | true | Show or hide pressure on the card. |
| show_wind_direction | boolean | true | Show or hide wind_direction on the card. |
| show_wind_speed | boolean | true | Show or hide wind_speed on the card. |
| show_feels_like | boolean | false | Show or hide feels like temperature on the card. |
| show_dew_point | boolean | false | Show or hide dew point on the card. |
| show_wind_gust_speed | boolean | false | Show or hide wind gust speed on the card. |
| show_visibility | boolean | false | Show or hide visibility on the card. |
| show_description | boolean | false | Show or hide the weather description on the card. |
| show_last_changed | boolean | false | Show or hide when last data changed on the card. |
| show_forecast_toggle | boolean | false | Show or hide the Daily/Hourly toggle button in the top-right corner. |
| use_12hour_format | boolean | false | Display time in 12-hour format (AM/PM) instead of 24-hour format. |
| icons | string | none | Path to the location of custom icons in svg format, for example /local/weather-icons/. |
| animated_icons | boolean | false | Enable the use of animated icons |
| icon_style | string | 'style1' | Options are 'style1' and 'style2' for different set of animated icons. |
| icons_size | number | 25 | The size of the animated or custom icons in pixels. |
| main_icon_size | number | 90 | Size of main current weather icon in pixels. |
| current_temp_size | number | 28 | The size of the current temperature in pixels. |
| time_size | number | 26 | The size of the current time in pixels. |
| day_date_size | number | 15 | The size of the current day and date in pixels. |
| forecast | object | none | See forecast options for available options. |
| units | object | none | See units of measurement for available options. |
| locale | string | none | See Supported languages for available languages |
| autoscroll | boolean | false | Update the chart each hour, hiding prior forecast datapoints |
| Name | Type | Default | Description |
|---|---|---|---|
| precipitation_type | string | rainfall | Show precipitation in 'rainfall' or 'probability'. |
| show_probability | boolean | false | Also show probability value when precipitation_type = rainfall. (Only when available) |
| labels_font_size | number | 11 | Font size for temperature and precipitation labels. |
| precip_bar_size | number | 100 | Adjusts the thickness of precipitation bars (1-100). |
| temperature1_color | string | rgba(255, 152, 0, 1.0) | High/day temperature line color (used when use_color_thresholds is false). |
| temperature2_color | string | rgba(68, 115, 158, 1.0) | Low/night temperature line color. |
| precipitation_color | string | rgba(132, 209, 253, 1.0) | Precipitation bar chart color. |
| use_color_thresholds | boolean | true | Enable automatic temperature-based gradient colors for high temperature line (6 comfort levels). |
| chart_datetime_color | string | primary-text-color | Chart day or hour color |
| chart_text_color | string | none | Chart text color |
| chart_height | number | 180 | Adjust the forecast chart height |
| condition_icons | boolean | true | Show or hide forecast condition icons. |
| condition_icon_size_multiplier | number | 2.0 | Multiplier for condition icon size relative to icons_size (0.5-4.0). |
| show_wind_forecast | boolean | true | Show or hide wind forecast on the card. |
| round_temp | boolean | false | Option for rounding the forecast temperatures |
| style | string | style1 | Change chart style, options: 'style1' or 'style2' |
| type | string | daily | Show daily or hourly forecast if available, options: 'daily' or 'hourly' |
| daily_entity | string | (main entity) | Optional weather.* entity to source the daily forecast from. Falls back to the main entity. |
| hourly_entity | string | (main entity) | Optional weather.* entity to source the hourly forecast from. Falls back to the main entity. |
| number_of_forecasts | number | 0 | Overrides the number of forecasts to display. Set to "0" for automatic mode. |
| disable_animation | boolean | false | Disable the chart animation. |
| show_date_labels | boolean | true | Show date numbers below weekday labels in daily forecast view. |
| Name | Type | Default | Description |
|---|---|---|---|
| pressure | string | none | Convert to 'hPa' or 'mmHg' or 'inHg' |
| speed | string | none | Convert to 'km/h' or 'm/s' or 'Bft' or 'mph' |
| temperature | string | none | Convert to '°C' or '°F'. Applies to current temp, feels like, and forecast temperatures. |
type: custom:weather-chart-card-ha
entity: weather.weather_home
show_time: true
show_day: true
show_date: true
animated_icons: true
icon_style: style1type: custom:weather-chart-card-ha
entity: weather.weather_home
show_forecast_toggle: true
show_time: true
show_day: true
show_date: true
animated_icons: true
forecast:
type: daily # Starting view (user can toggle to hourly)type: custom:weather-chart-card-ha
entity: weather.my_home
forecast:
style: style2type: custom:weather-chart-card-ha
entity: weather.my_home
show_main: false
show_attributes: false
forecast:
condition_icons: false
show_wind_forecast: falsetype: custom:weather-chart-card-ha
entity: weather.my_home
units:
pressure: mmHg
speed: m/s
temperature: °Ftype: custom:weather-chart-card-ha
entity: weather.my_home
show_time: true
show_day: true
show_date: true
timezone: America/New_YorkPerfect for monitoring weather in multiple locations with different units and timezones:
# Issaquah (Imperial Units, PST)
type: custom:weather-chart-card-ha
entity: weather.forecast_issaquah
location_name: "Issaquah"
timezone: "America/Los_Angeles"
locale: en-US # or simple: en
units:
  temperature: "°F"
  pressure: "inHg"
  speed: "mph"
forecast:
  show_date_labels: true
  condition_icon_size_multiplier: 2.0
  use_color_thresholds: true

# Câmpina (Metric Units, EET)
type: custom:weather-chart-card-ha
entity: weather.forecast_campina
location_name: "Câmpina"
timezone: "Europe/Bucharest"
locale: ro-RO # or simple: ro
units:
  temperature: "°C"
  pressure: "mmHg"
  speed: "km/h"
forecast:
  show_date_labels: true
  condition_icon_size_multiplier: 2.0
use_color_thresholds: trueThe card automatically colors the high temperature line based on comfort levels with a 6-level spectrum:
- < 5°C / 41°F: Dark Blue (Cold)
- 5-15°C / 41-59°F: Light Blue (Cool)
- 15-22°C / 59-72°F: Green (Comfortable - good weather range)
- 22-26°C / 72-79°F: Yellow (Pleasant/Warm)
- 26-32°C / 79-90°F: Orange (Hot)
- > 32°C / 90°F: Red (Very Hot)
The night temperature line displays as a dashed line in solid color for easy distinction.
Enabled by default. Example configuration:
type: custom:weather-chart-card-ha
entity: weather.my_home
forecast:
  use_color_thresholds: true  # Enable gradient colors (default)
  style: style2
To disable automatic gradients and use solid colors:
type: custom:weather-chart-card-ha
entity: weather.my_home
forecast:
  use_color_thresholds: false
  temperature1_color: rgba(255, 152, 0, 1.0)
temperature2_color: rgba(68, 115, 158, 1.0)Show date numbers below weekday labels for better context:
type: custom:weather-chart-card-ha
entity: weather.my_home
forecast:
  type: daily
show_date_labels: true # Shows "MON" and "8" on separate linesFine-tune icon sizes for your layout:
type: custom:weather-chart-card-ha
entity: weather.my_home
icons_size: 20                                    # Base icon size
main_icon_size: 90                                # Main weather icon
forecast:
condition_icon_size_multiplier: 1.5 # Forecast icons (20 × 1.5 = 30px)Icons should be in SVG format. Icons should have names as shown here.
Example:
- Clear browser cache (Ctrl+Shift+R / Cmd+Shift+R)
- Check browser console for errors (F12)
- Verify resource is loaded in Settings → Dashboards → Resources
- Try incognito/private browsing mode
- Ensure
use_color_thresholds: truein forecast config - Check that temperature data is available from weather entity
- Verify units are set correctly (°F or °C)
- Set explicit timezone:
timezone: "America/Los_Angeles" - Verify timezone is valid IANA timezone
- Restart Home Assistant after changes
- Ensure card is installed (check HACS or www folder)
- Verify resource is added correctly
- Check Home Assistant logs for errors
- Try removing and re-adding the card
For developers who want to test changes without installing the card in Home Assistant, we provide a comprehensive test suite with mock data and interactive controls.
- Install dependencies:
npm install- Start the development server:
npm startThis will start a local server on port 5500 with automatic rebuilding when source files change.
- Open the test suite:
Navigate to
http://localhost:5500/test.htmlin your browser.
The test page provides a full-featured testing environment with:
Weather Conditions (11 options)
- Test all weather states: Sunny, Cloudy, Partly Cloudy, Rainy, Pouring, Snowy, Fog, Lightning, Hail, Windy, Clear Night
- Each condition includes realistic mock data (temperature, humidity, pressure, wind, visibility)
- Auto-cycling mode to automatically test all conditions
Multi-Language Support (10 languages)
- Test translations: English, German, French, Spanish, Italian, Dutch, Polish, Russian, Romanian, Korean
- Weather descriptions update based on language selection
- Auto-cycling mode for language testing
Interactive Controls
- Theme toggle (Light/Dark mode)
- Forecast type switching (Daily/Hourly)
- Icon style switching (Fill/Line icons from local directories)
- Manual condition and language selection
- Auto-cycle modes for automated testing
Real-Time Features
- Live clock display with seconds
- Current date and day
- All card features enabled by default
- Status bar showing current condition, language, and forecast type
Development Benefits
- Automatic rebuilding on file changes
- Source maps for debugging
- No Home Assistant installation required
- Instant feedback on UI changes
- Test all features without integration dependencies
To stop the development server, press Ctrl+C in the terminal where it's running.
npm run buildThe compiled file will be in dist/weather-chart-card-ha.js
| Language | Locale |
|---|---|
| Bulgarian | bg |
| Catalan | ca |
| Czech | cs |
| Danish | da |
| Dutch | nl |
| English | en |
| Finnish | fi |
| French | fr |
| German | de |
| Greek | el |
| Hungarian | hu |
| Italian | it |
| Lithuanian | lt |
| Norwegian | no |
| Polish | pl |
| Portuguese | pt |
| Romanian | ro |
| Russian | ru |
| Slovak | sk |
| Spanish | es |
| Swedish | sv |
| Ukrainian | uk |
| 한국어 | ko |
Contributions are welcome! Please feel free to submit issues and pull requests.
# Clone the repository
git clone https://github.com/w4mhi/weather-chart-card-ha.git
cd weather-chart-card-ha

# Install dependencies
npm install

# Start development server
npm start

# Build for production
npm run buildSee Releases for version history and changes.
- Original Card: mlamberts78 - Created the original weather-chart-card-ha
- Weather Icons: Basmilius - Beautiful animated weather icons (served via this project's CDN for reliability)
- Enhancements: W4MHI - Temperature gradients, timezone support, daily/hourly toggle, layout improvements
This project is licensed under the MIT License - see the LICENSE file for details.
If you find this card useful, please consider:
- ⭐ Starring the repository
- 🐛 Reporting issues
- 💡 Suggesting new features
- 🔀 Contributing code
Made with ❤️ by W4MHI