


An open-source profiler plugin for JDK 11+ based on JFR, async-profiler, Firefox Profiler, and Jeffrey.
This plugin supports
- profiling Java applications directly from run configurations using JFR or async-profiler
- attaching to already-running JVMs from the "JFR Recording" tool window — start and stop recordings without restarting the process
- viewing JFR files with Firefox Profiler or Jeffrey (click frames in Jeffrey's flame graph to jump directly to source)
- CPU-time profiling via
jdk.CPUTimeSample(JEP 509) on Java 25+ Linux runtimes - flamegraphs, call trees, function tables, marker timelines, allocation profiles, and more
This plugin is under active development; feel free to try it and open issues for any bugs or suggestions.
See my blog post Firefox Profiler beyond the web for a detailed description and how I ended up there.
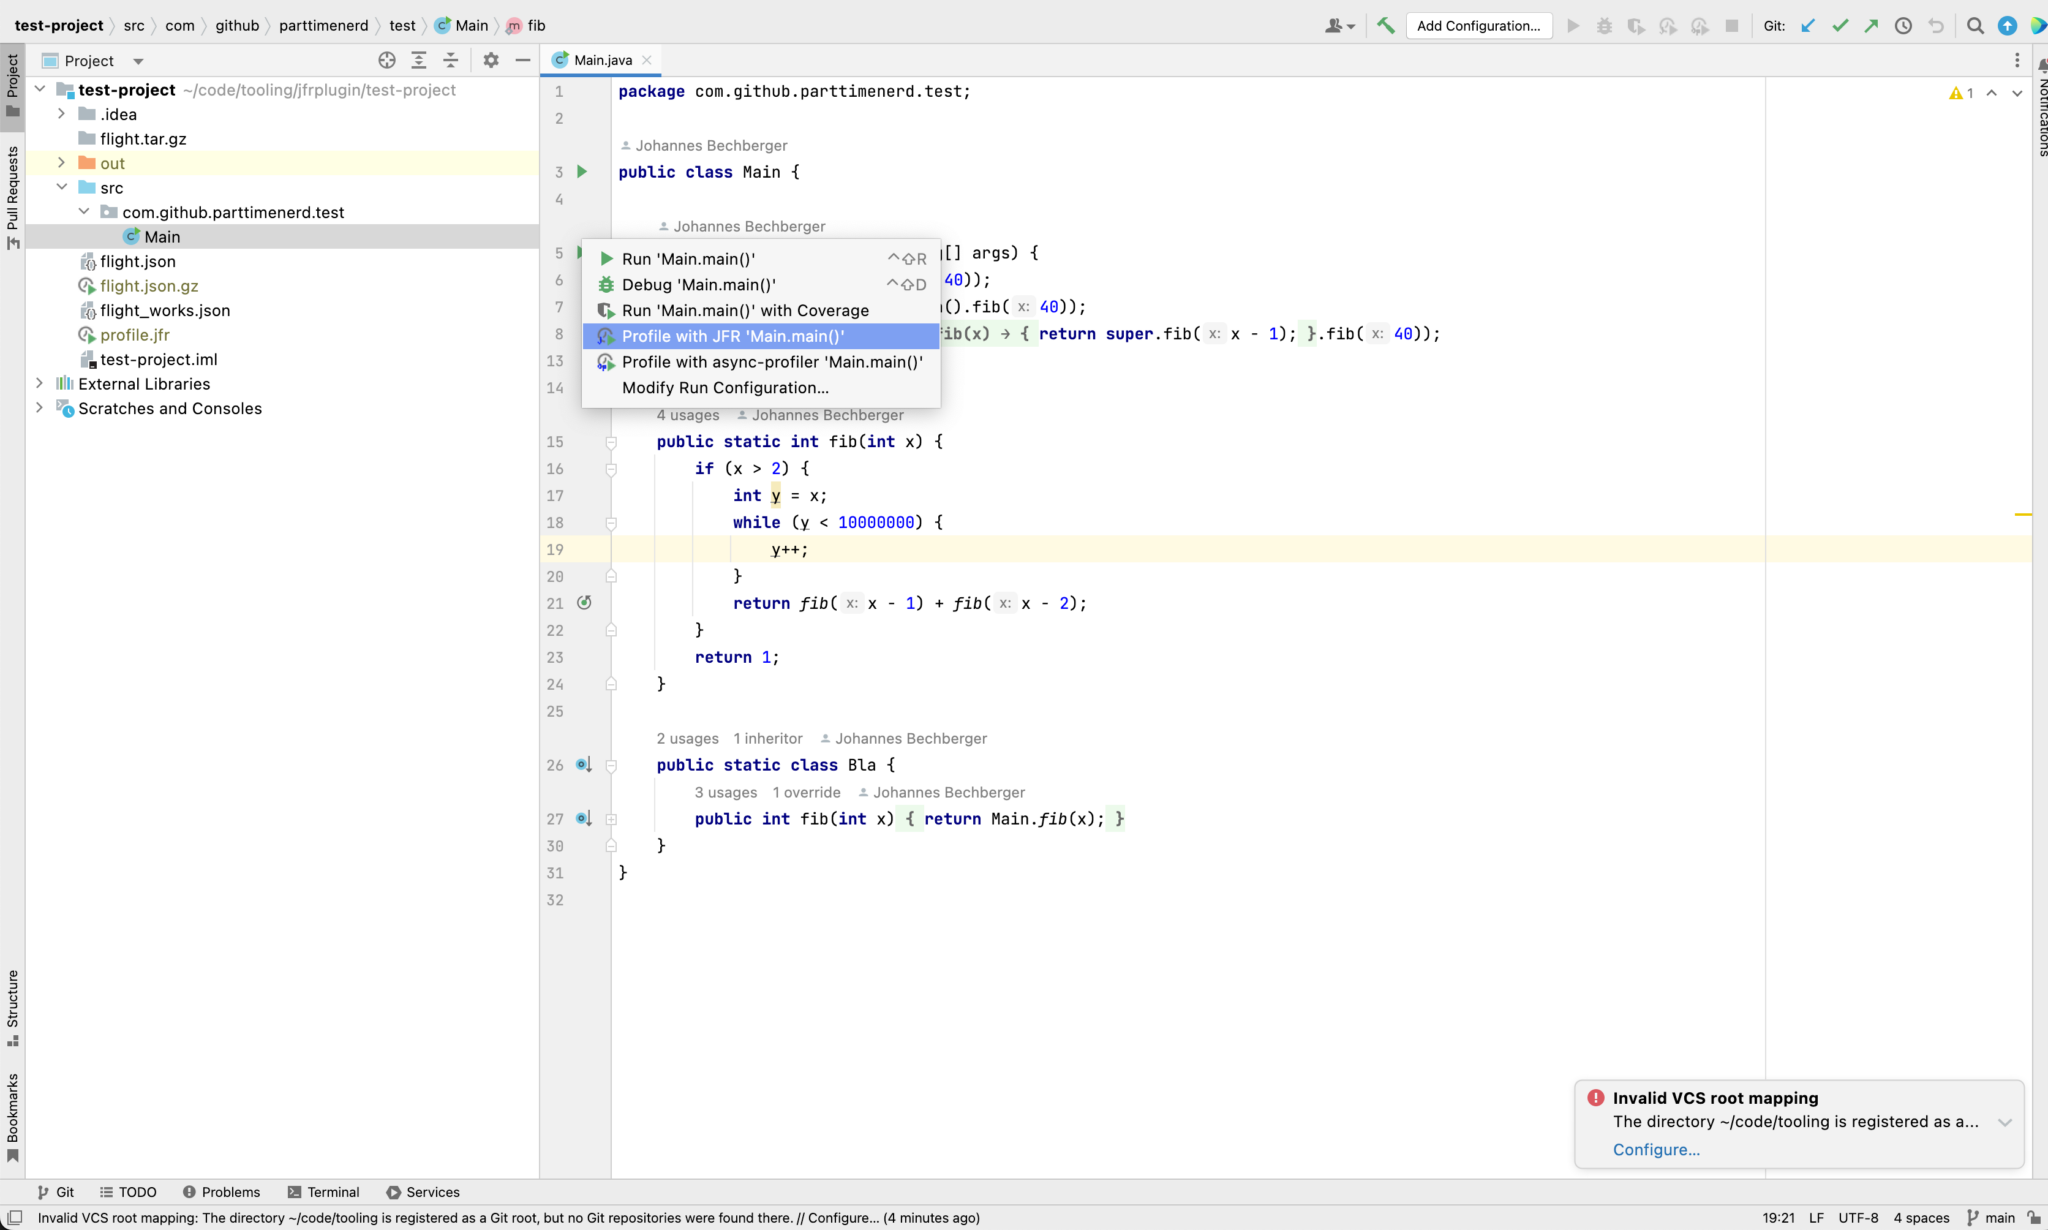
The plugin adds a "Profile with JFR" and "Profile with async-profiler" action to all Java run configurations. After the run finishes the profile opens automatically in the editor.
My plugin adds a context menu for profiling:
The "JFR Recording" tool window (View → Tool Windows → JFR Recording) lists all local JVMs. For each process you can start a JFR or async-profiler recording with one click and stop it when done — no restart required. The resulting JFR file opens automatically.
Opening any .jfr file shows it in the built-in viewer. You can switch between
Firefox Profiler and
Jeffrey using the dropdown in the editor toolbar.
Right-click a .jfr file in the project tree and choose Open with Jeffrey to open it directly in Jeffrey.
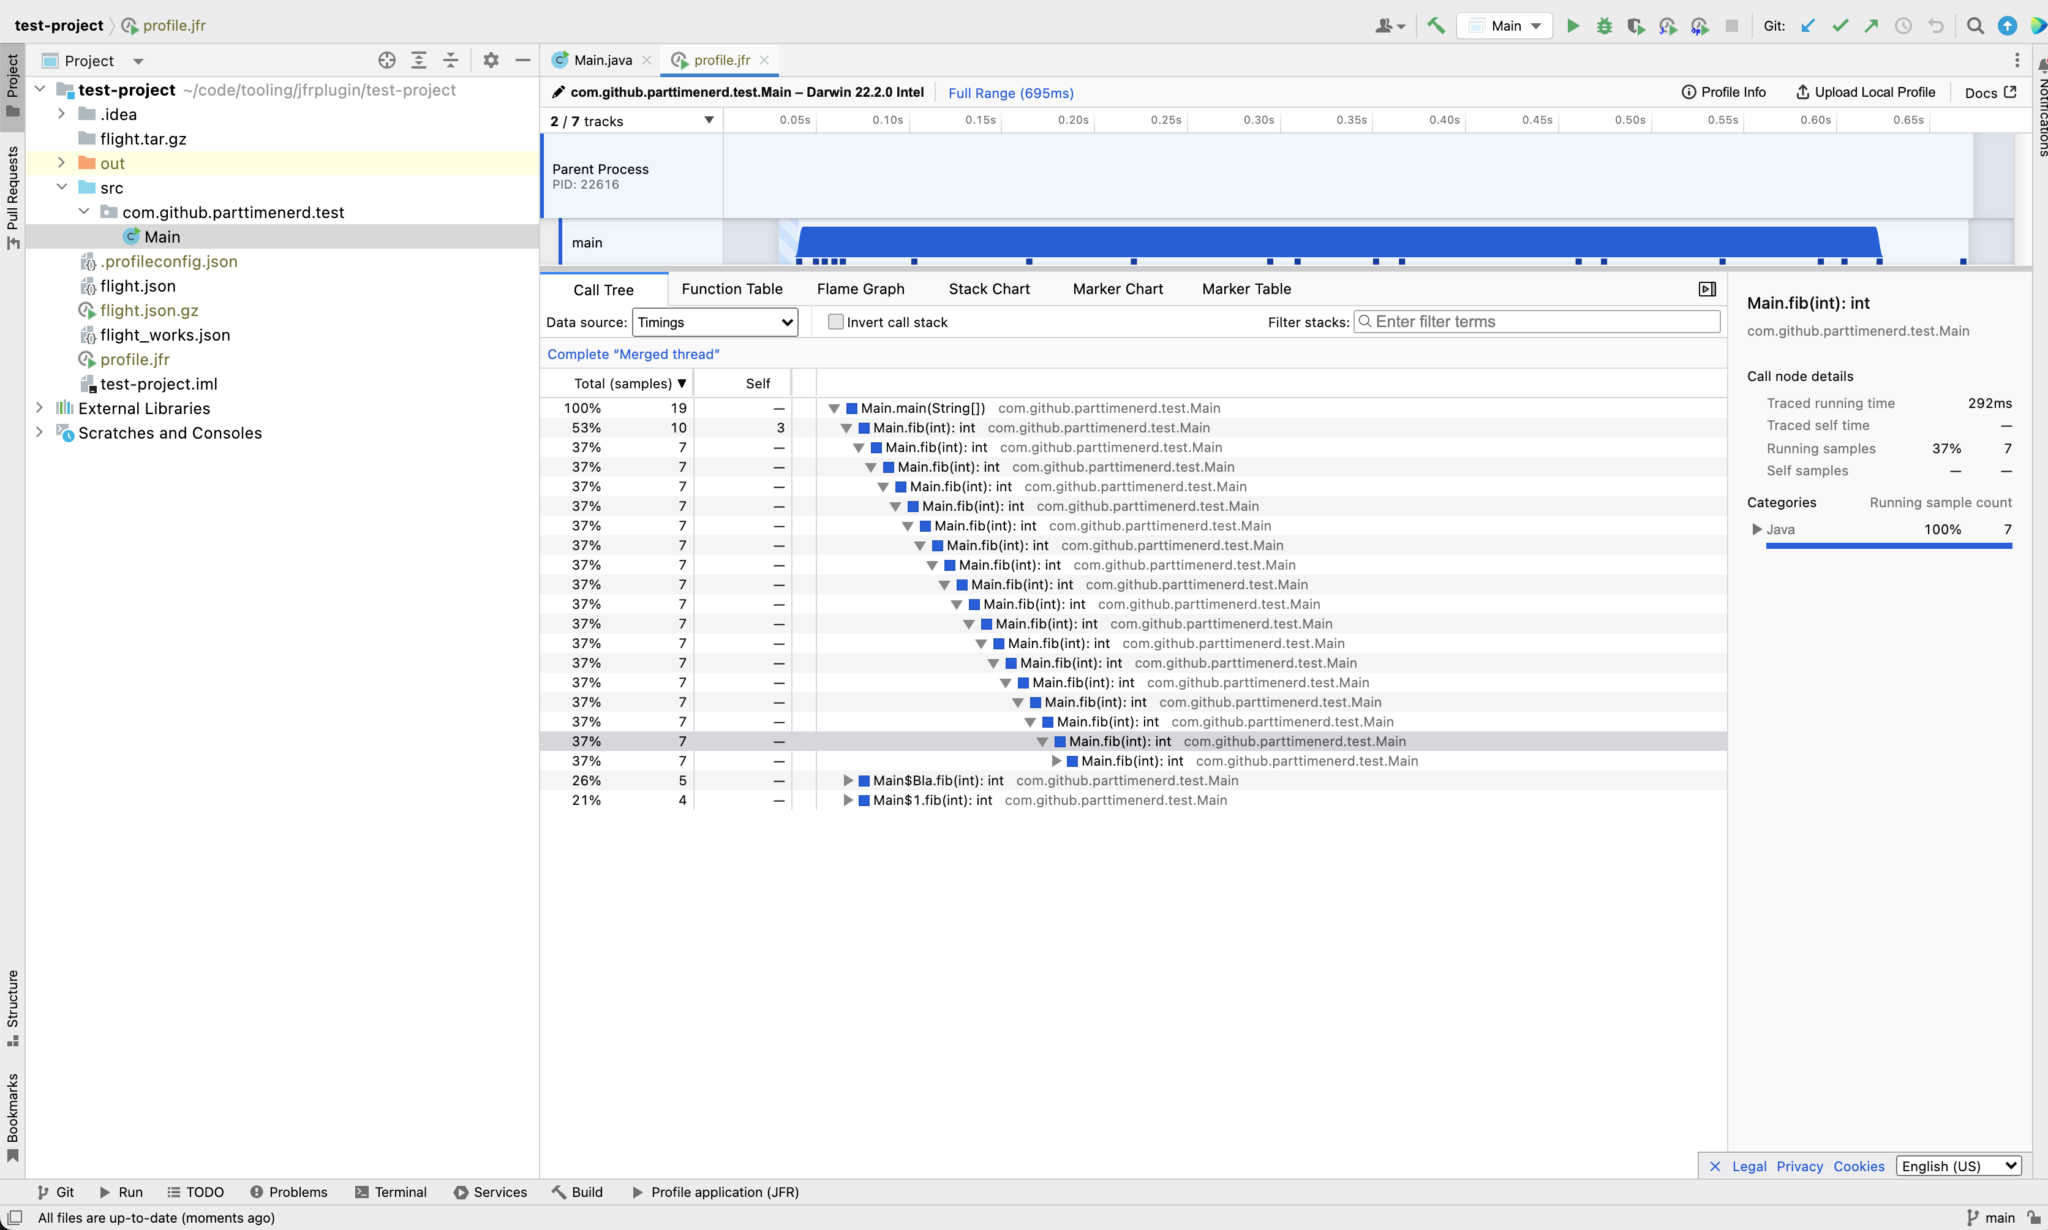
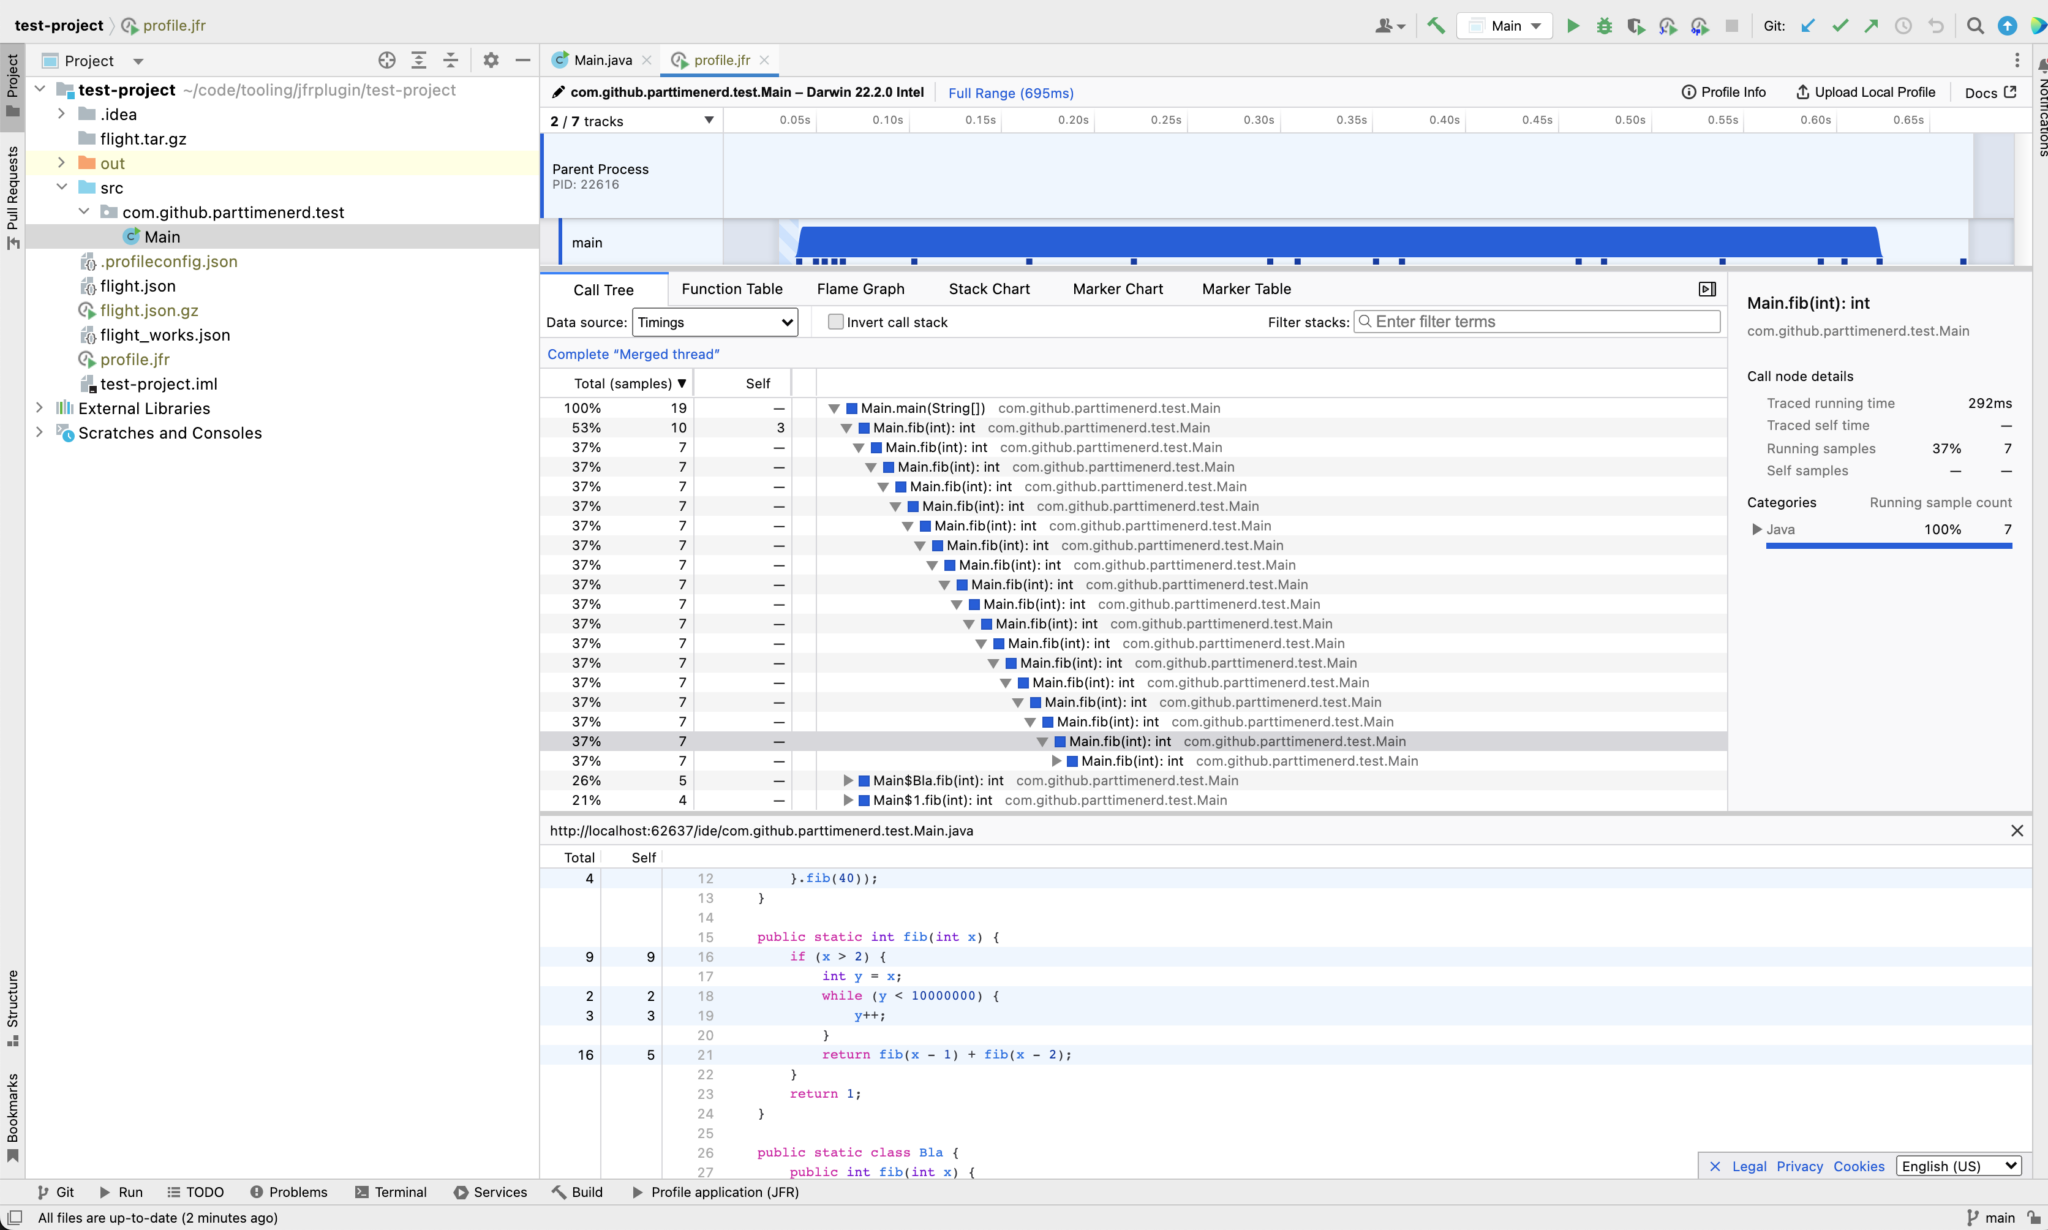
You can double-click on a method in the profiler to navigate to it in the IDE, or shift-double-click to view the source code directly in the profiler:
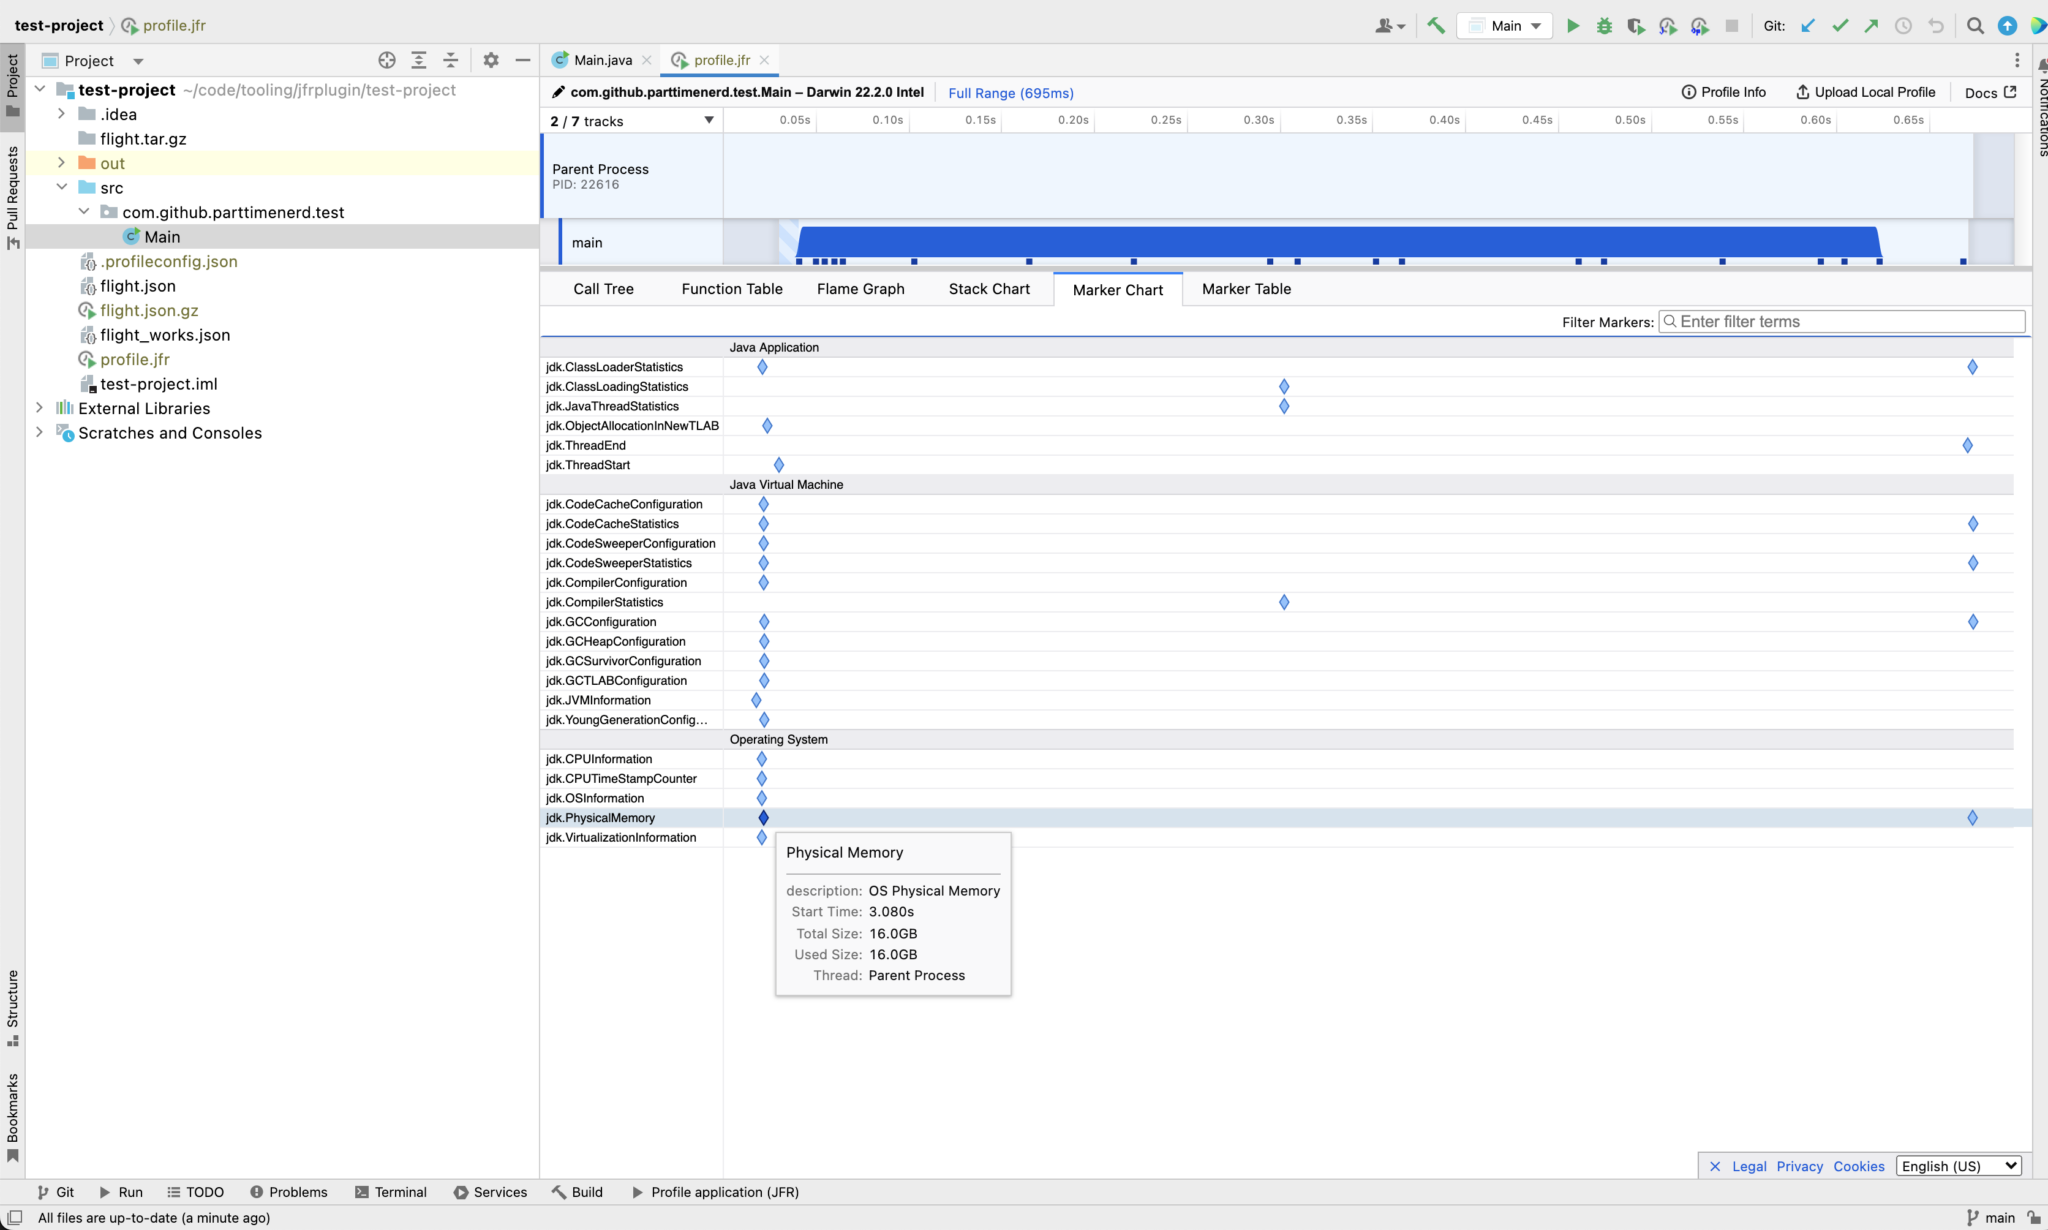
All JFR events are visible as marker tracks:
Available as Java JFR Profiler in the JetBrains marketplace.
You can also download the latest version from here and install it manually via Settings → Plugins → Install Plugin from Disk.
The plugin is a thin wrapper around jfrtofp-server, which bundles the JFR → Firefox Profiler converter and a custom Firefox Profiler build with Java-specific features not yet upstream.
Async-profiler support uses ap-loader.
JVM attach uses the standard com.sun.tools.attach API and jdk.management.jfr.FlightRecorderMXBean.
Jeffrey is bundled as an alternative viewer and launched automatically.
- run JFR or async-profiler on all Java run configurations with a single click
- attach to running JVMs without restarting
- be the bridge between simple built-in profilers and advanced tools like JDK Mission Control
- fully fledged analysis
- JDK Mission Control replacement