





A tiny, modular menu-bar (NSStatusItem) app in Rust that shows live stats on two compact, color-coded lines:
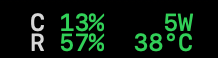
Updates every 2 seconds. Right-click for launch-at-login and Quit. That's the whole app — and that's the point.
The premise. Most menu-bar monitors slowly become what they measure: background threads, growing buffers, tens of MB of RSS. featherbar runs zero background threads and allocates nothing that accumulates — one main-thread event loop wakes on a timer, takes one sample, redraws the display, and re-arms. Memory stays flat for as long as it runs.
- Live stats on two stacked lines: CPU % + battery watts on top, RAM % + CPU temperature below, refreshed every 2s
- Color-coded severity: each value renders green / orange / red by its own thresholds (CPU 40/70%, RAM 60/80%, power 10/20W, temp 60/80°C); labels stay neutral
- Perfectly gridded: SF Mono with fixed-width value fields — nothing shifts when a value changes digit count
- No Dock icon, no window:
ActivationPolicy::Accessory— it exists only in the menu bar - No background threads: a single main-thread
taoevent loop withControlFlow::WaitUntiltimer wakes — even sysinfo's rayon pool is compiled out - Launch at login toggle: right-click menu check item backed by
SMAppService(when running as the.appbundle) - Flat memory by design: one
Samplerowns all sampling state, oneRendererowns all drawing state; every tick's ObjC temporaries die in an explicit autorelease pool - Measured footprint: 11 MB at launch, settling at a flat ~20 MB steady state (
phys_footprint, the Activity Monitor number) on an M-series MacBook Pro — soak-profiled leak-free withleaks(live heap ~6.5 MB; the rest is one-time allocator high-water, and it stops moving) - Modular metrics: adding a stat is an enum variant + a match arm — nothing else changes
- Tiny binary: ~800 KB release build (
opt-level = "z", LTO, stripped)
flowchart LR
    T["Timer wake<br/>(every 2s)"] --> S["Sampler<br/>one owner, no allocation"]
    S --> C["CPU % + temp<br/>sysinfo"]
    S --> R["RAM %<br/>sysinfo"]
    S --> P["Power W<br/>starship-battery"]
    C --> O["Renderer<br/>two color-coded lines<br/>drawn into the status icon"]
    R --> O
    P --> O
    O --> T
1. Requirements
- macOS on Apple Silicon (M-series)
- Rust 1.89+ (required by
starship-battery)
2. Installation
git clone https://github.com/nim444/featherbar.git
cd featherbar

# Build the release binary and assemble Featherbar.app (ad-hoc signed)
./scripts/bundle.sh
cp -R target/Featherbar.app /Applications/
open /Applications/Featherbar.app# From crates.io
cargo install featherbar
featherbar
# Or from a checkout
cargo run --releaseThe reading appears in your menu bar immediately. There is no Dock icon and no window — right-click the menu-bar text for the menu and Quit.
Right-click the menu-bar reading and check Launch at login. The toggle uses Apple's SMAppService API, which only works from a real .app bundle — from a bare cargo run binary the item is shown disabled. Verify the registration anytime in System Settings → General → Login Items.
3. Project Structure
├── src/
│   ├── main.rs          # Metric enum, Sampler, thresholds, event loop, menu
│   ├── two_line.rs      # Renderer: two color-coded lines drawn into the icon
│   └── login_item.rs    # Launch-at-login via SMAppService
├── scripts/
│   └── bundle.sh        # Assemble Featherbar.app from the release binary
├── assets/
│   └── menubar.png
├── Cargo.toml           # size-optimized release profile, trimmed features
├── Cargo.lock
├── LICENSE              # Apache-2.0
└── README.md
Three source files on purpose. The app is small enough that splitting it up further would only add indirection.
4. How It Works
The hard macOS constraints this design satisfies:
- The
taoevent loop must run on the main thread, and the tray icon must be created on that same thread. - The tray icon is created after the loop is running — on
StartCause::Init, not before. ActivationPolicy::Accessorykeeps it out of the Dock and the app switcher.
The loop itself:
StartCause::Init— create the tray icon, locate itsNSStatusBarButton, draw the first reading, arm a 2sControlFlow::WaitUntiltimer.StartCause::ResumeTimeReached— drain the menu-event channel (Quit? login toggle?), take one sample per enabled metric, redraw, re-arm.- Nothing else. No threads, no channels to background workers, no history buffers.
Why the display is an image: NSStatusItem text titles are vertically centered by the button cell with no working override, and a single-line title can't stack two rows. So the Renderer draws both lines into an NSImage each tick — glyph positions computed from real font metrics (cap height, descent), colors per severity, Retina-sharp. The button can't fight pixels.
Why memory stays flat: one Sampler owns the sysinfo::System (created empty — no process table), the component list, and a single battery handle refreshed in place; one Renderer owns the font and four prebuilt attribute dictionaries. Per tick only the strings and the image are created, and an explicit autoreleasepool kills them before the loop sleeps again. The footprint rises from 11 MB at launch to ~20 MB as the malloc zones reach their high-water mark, then stops: a profiled soak shows ~6.5 MB live heap, no featherbar leaks, and a flat line from there.
Measure it yourself while it runs (same metric Activity Monitor shows):
footprint $(pgrep -x featherbar)
# featherbar [pid]: 64-bit    Footprint: 11 MB   (launch; settles at ~20 MB and stays flat)
5. Adding a Metric
Three edits, all in src/main.rs:
// 1. Add a variant
enum Metric {
    Ram,
    Cpu,
    Power,
    Temp,
    DiskFree, // new
}

// 2. Add a match arm in Sampler::fragment that pushes label/value Segs
Metric::DiskFree => {
    out.push(Seg::new("D", Level::Neutral));
    out.push(Seg::new(format!("{}G", pad(free_gb, 3, 0)), disk_level(free_gb)));
}

// 3. Put it on a line
const LINE_TOP: &[Metric] = &[Metric::Cpu, Metric::Power];
const LINE_BOTTOM: &[Metric] = &[Metric::Ram, Metric::Temp, Metric::DiskFree];
Good candidates with maintained crates and no reverse engineering: network up/down (sysinfo networks), disk free (sysinfo disks), battery % (starship_battery).
6. Behavior Notes (not bugs)
- Power reads
0Won AC or at full charge. The watt figure is the battery charge/discharge rate (energy_rate), so it is only meaningful while running on battery. It is NOT total system/SoC power. - Power may read
0Wfor a minute right after unplugging. The battery fuel gauge reportsInstantAmperage = 0until real discharge current registers — featherbar shows exactly what the SMC reports. Verify the OS-side value withioreg -rn AppleSmartBattery | grep InstantAmperage. —Wis shown when no battery is available;—°Cwhen no die sensor is found.- Temperature is the hottest CPU die sensor (
PMU tdie*), which is what "CPU temp" colloquially means — individual sensors run cooler. - The first CPU sample may be off for one tick until the second refresh lands.
7. Scope — what featherbar will not do
Fans and total SoC/package power are out of scope. They require undocumented IOKit/SMC keys that break with each new Apple Silicon generation — the exact maintenance treadmill this project exists to avoid. (CPU temperature is shown, but through sysinfo's maintained Components API — the PMU die sensors — not hand-rolled SMC keys.) If you need fans or package watts, Stats does them well and pays that maintenance cost for you.
8. Tech Stack
| Layer | Crate |
|---|---|
| Menu-bar icon (NSStatusItem) | tray-icon 0.21 |
| Main-thread event loop | tao 0.34 |
| RAM / CPU sampling | sysinfo 0.33 |
| Battery power draw | starship-battery 0.10 |
Release profile: opt-level = "z", lto = true, strip = true → ~800 KB binary.
- SMC
PSTR(system total power) reader behindMetric::Power, with fallback to battery watts — total consumption with or without AC, accepting the undocumented-key tradeoff - Network up/down and disk-free metrics
- A settings menu to toggle which metrics are shown at runtime
