Hey guys, great work. Really appreciate this package.
Is it a feature or a bug that the variable name of the actual values in the output from sweep() are sometimes the name from the data and sometimes another name?
library(tidyverse)
library(forecast)
#>
#> Attaching package: 'forecast'
#> The following object is masked from 'package:ggplot2':
#>
#>     autolayer
library(tidyquant)
#> Loading required package: lubridate
#>
#> Attaching package: 'lubridate'
#> The following object is masked from 'package:base':
#>
#>     date
#> Loading required package: PerformanceAnalytics
#> Loading required package: xts
#> Loading required package: zoo
#>
#> Attaching package: 'zoo'
#> The following objects are masked from 'package:base':
#>
#>     as.Date, as.Date.numeric
#>
#> Attaching package: 'xts'
#> The following objects are masked from 'package:dplyr':
#>
#>     first, last
#>
#> Attaching package: 'PerformanceAnalytics'
#> The following object is masked from 'package:graphics':
#>
#>     legend
#> Loading required package: quantmod
#> Loading required package: TTR
#> Version 0.4-0 included new data defaults. See ?getSymbols.
library(timetk)
library(sweep)

# monthly
monthly_qty_by_cat2 <- bike_sales %>%
  mutate(order.month = as_date(as.yearmon(order.date))) %>%
  group_by(category.secondary, order.month) %>%
  summarise(total.qty = sum(quantity))

# grouping
monthly_qty_by_cat2_nest <- monthly_qty_by_cat2 %>%
  group_by(category.secondary) %>%
  nest(.key = "data.tbl")

# to ts
monthly_qty_by_cat2_ts <- monthly_qty_by_cat2_nest %>%
  mutate(data.ts = map(.x       = data.tbl,
                       .f       = tk_ts,
                       select   = -order.month,
                       start    = 2011,
                       freq     = 12))


# tbats
monthly_qty_by_cat2_fit <- monthly_qty_by_cat2_ts %>%
  mutate(fit.tbats = map(data.ts, tbats))


monthly_qty_by_cat2_fcast <- monthly_qty_by_cat2_fit %>%
  mutate(fcast.tbats = map(fit.tbats, forecast, h = 12))


monthly_qty_by_cat2_fcast_tidy <- monthly_qty_by_cat2_fcast %>%
  mutate(sweep = map(fcast.tbats, sw_sweep, fitted = FALSE, timetk_idx = TRUE)) %>%
  unnest(sweep)

colnames(monthly_qty_by_cat2_fcast_tidy)
#> [1] "category.secondary" "index"              "key"
#> [4] "total.qty"          "lo.80"              "lo.95"
#> [7] "hi.80"              "hi.95"

monthly_qty_by_cat2_fcast_tidy %>%
  ggplot(aes(x = index, y = total.qty, color = key, group = category.secondary)) +
  geom_ribbon(aes(ymin = lo.95, ymax = hi.95),
              fill = "#D5DBFF", color = NA, size = 0) +
  geom_ribbon(aes(ymin = lo.80, ymax = hi.80, fill = key),
              fill = "#596DD5", color = NA, size = 0, alpha = 0.8) +
  geom_line() +
  labs(title = "Bike Quantity Sold By Secondary Category",
       subtitle = "ETS Model Forecasts",
       x = "", y = "Units") +
  scale_x_date(date_breaks = "1 year", date_labels = "%Y") +
  scale_color_tq() +
  scale_fill_tq() +
  facet_wrap(~ category.secondary, scales = "free_y", ncol = 3) +
  theme_tq() +
  theme(axis.text.x = element_text(angle = 45, hjust = 1))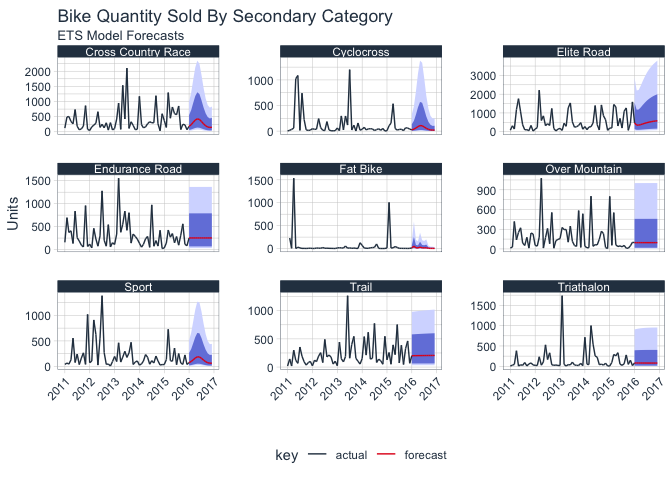
# tbats
monthly_qty_by_cat2_fit <- monthly_qty_by_cat2_ts %>%
  mutate(fit.StructTS = map(data.ts, StructTS))


monthly_qty_by_cat2_fcast <- monthly_qty_by_cat2_fit %>%
  mutate(fcast.StructTS = map(fit.StructTS, forecast, h = 12))


monthly_qty_by_cat2_fcast_tidy <- monthly_qty_by_cat2_fcast %>%
  mutate(sweep = map(fcast.StructTS, sw_sweep, fitted = FALSE, timetk_idx = TRUE)) %>%
  unnest(sweep)

colnames(monthly_qty_by_cat2_fcast_tidy)
#> [1] "category.secondary" "index"              "key"
#> [4] "value"              "lo.80"              "lo.95"
#> [7] "hi.80"              "hi.95"

monthly_qty_by_cat2_fcast_tidy %>%
  ggplot(aes(x = index, y = total.qty, color = key, group = category.secondary)) +
  geom_ribbon(aes(ymin = lo.95, ymax = hi.95),
              fill = "#D5DBFF", color = NA, size = 0) +
  geom_ribbon(aes(ymin = lo.80, ymax = hi.80, fill = key),
              fill = "#596DD5", color = NA, size = 0, alpha = 0.8) +
  geom_line() +
  labs(title = "Bike Quantity Sold By Secondary Category",
       subtitle = "ETS Model Forecasts",
       x = "", y = "Units") +
  scale_x_date(date_breaks = "1 year", date_labels = "%Y") +
  scale_color_tq() +
  scale_fill_tq() +
  facet_wrap(~ category.secondary, scales = "free_y", ncol = 3) +
  theme_tq() +
  theme(axis.text.x = element_text(angle = 45, hjust = 1))
#> Error in FUN(X[[i]], ...): object 'total.qty' not found
Created on 2018-05-30 by the reprex package (v0.2.0).
Hey guys, great work. Really appreciate this package.
Is it a feature or a bug that the variable name of the actual values in the output from
sweep()are sometimes the name from the data and sometimes another name?Created on 2018-05-30 by the reprex package (v0.2.0).