
Please note that all the information regarding the case study has been sourced from the following link: here.
Fresh Segments is a digital marketing agency that helps other businesses analyse trends in online ad click behaviour for their unique customer base.
Clients share their customer lists with the Fresh Segments team who then aggregate interest metrics and generate a single dataset worth of metrics for further analysis.
In particular - the composition and rankings for different interests are provided for each client showing the proportion of their customer list who interacted with online assets related to each interest for each month.
Danny has asked for your assistance to analyse aggregated metrics for an example client and provide some high level insights about the customer list and their interests.
Table: interest_map
| id | interest_name | interest_summary | created_at | last_modified |
|---|---|---|---|---|
| 1 | Fitness Enthusiasts | Consumers using fitness tracking apps and websites. | 2016-05-26T14:57:59.000 | 2018-05-23T11:30:12.000 |
| 2 | Gamers | Consumers researching game reviews and cheat codes. | 2016-05-26T14:57:59.000 | 2018-05-23T11:30:12.000 |
| 3 | Car Enthusiasts | Readers of automotive news and car reviews. | 2016-05-26T14:57:59.000 | 2018-05-23T11:30:12.000 |
| 4 | Luxury Retail Researchers | Consumers researching luxury product reviews and gift ideas. | 2016-05-26T14:57:59.000 | 2018-05-23T11:30:12.000 |
| 5 | Brides & Wedding Planners | People researching wedding ideas and vendors. | 2016-05-26T14:57:59.000 | 2018-05-23T11:30:12.000 |
| 6 | Vacation Planners | Consumers reading reviews of vacation destinations and accommodations. | 2016-05-26T14:57:59.000 | 2018-05-23T11:30:13.000 |
| 7 | Motorcycle Enthusiasts | Readers of motorcycle news and reviews. | 2016-05-26T14:57:59.000 | 2018-05-23T11:30:13.000 |
| 8 | Business News Readers | Readers of online business news content. | 2016-05-26T14:57:59.000 | 2018-05-23T11:30:12.000 |
| 12 | Thrift Store Shoppers | Consumers shopping online for clothing at thrift stores and researching locations. | 2016-05-26T14:57:59.000 | 2018-03-16T13:14:00.000 |
| 13 | Advertising Professionals | People who read advertising industry news. | 2016-05-26T14:57:59.000 | 2018-05-23T11:30:12.000 |
Table: interest_metrics
| month | year | month_year | interest_id | composition | index_value | ranking | percentile_ranking |
|---|---|---|---|---|---|---|---|
| 7 | 2018 | Jul-18 | 32486 | 11.89 | 6.19 | 1 | 99.86 |
| 7 | 2018 | Jul-18 | 6106 | 9.93 | 5.31 | 2 | 99.73 |
| 7 | 2018 | Jul-18 | 18923 | 10.85 | 5.29 | 3 | 99.59 |
| 7 | 2018 | Jul-18 | 6344 | 10.32 | 5.1 | 4 | 99.45 |
| 7 | 2018 | Jul-18 | 100 | 10.77 | 5.04 | 5 | 99.31 |
| 7 | 2018 | Jul-18 | 69 | 10.82 | 5.03 | 6 | 99.18 |
| 7 | 2018 | Jul-18 | 79 | 11.21 | 4.97 | 7 | 99.04 |
| 7 | 2018 | Jul-18 | 6111 | 10.71 | 4.83 | 8 | 98.9 |
| 7 | 2018 | Jul-18 | 6214 | 9.71 | 4.83 | 8 | 98.9 |
| 7 | 2018 | Jul-18 | 19422 | 10.11 | 4.81 | 10 | 98.63 |
Please join me in executing the queries using PostgreSQL on DB Fiddle. It would be great to work together on the questions!
If you have any questions, reach out to me on LinkedIn.
1. Update the fresh_segments.interest_metrics table by modifying the month_year column to be a date data type with the start of the month
ALTER TABLE fresh_segments.interest_metrics
ALTER month_year TYPE DATE USING month_year::DATE;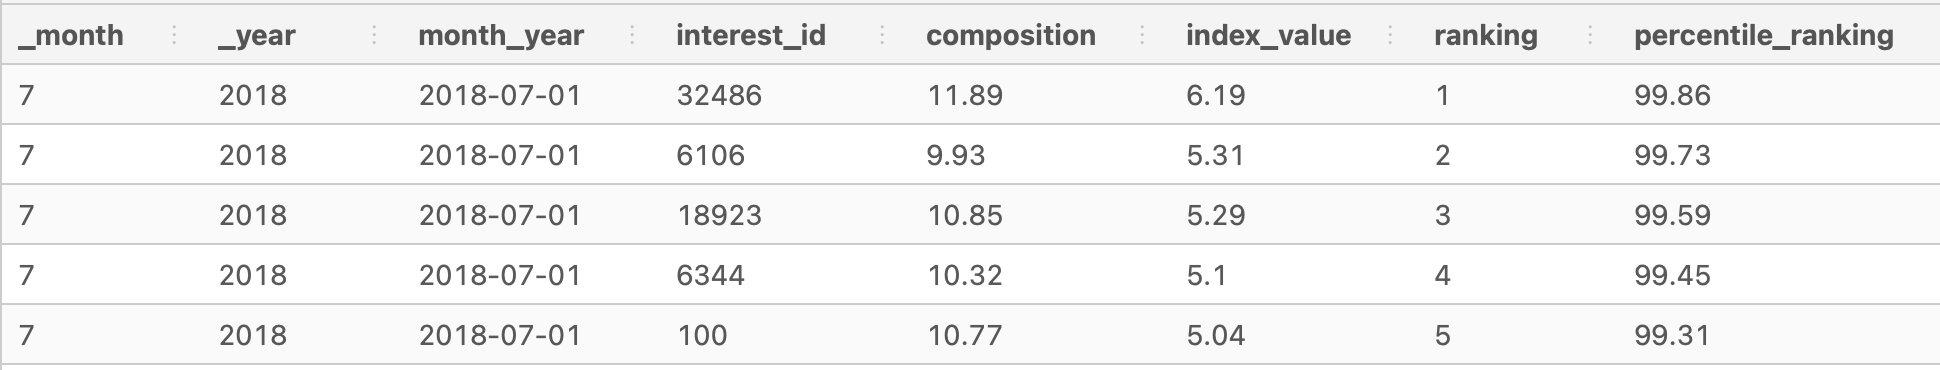
2. What is count of records in the fresh_segments.interest_metrics for each month_year value sorted in chronological order (earliest to latest) with the null values appearing first?
SELECT
  month_year, COUNT(*)
FROM fresh_segments.interest_metrics
GROUP BY month_year
ORDER BY month_year NULLS FIRST;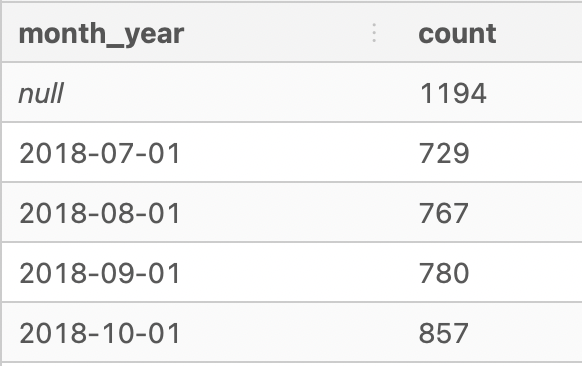
3. What do you think we should do with these null values in the fresh_segments.interest_metrics?
The null values appear in _month, _year, month_year, and interest_id. The corresponding values in composition, index_value, ranking, and percentile_ranking fields are not meaningful without the specific information on interest_id and dates.
Before dropping the values, it would be useful to find out the percentage of null values.
SELECT
  ROUND(100 * (SUM(CASE WHEN interest_id IS NULL THEN 1 END) * 1.0 /
    COUNT(*)),2) AS null_perc
FROM fresh_segments.interest_metrics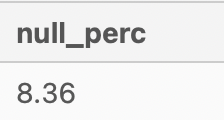
The percentage of null values is 8.36% which is less than 10%, hence I would suggest to drop all the null values.
DELETE FROM fresh_segments.interest_metrics
WHERE interest_id IS NULL;

-- Run again to confirm that there are no null values.
SELECT
  ROUND(100 * (SUM(CASE WHEN interest_id IS NULL THEN 1 END) * 1.0 /
    COUNT(*)),2) AS null_perc
FROM fresh_segments.interest_metrics
Confirmed that there are no null values in fresh_segments.interest_metrics.
4. How many interest_id values exist in the fresh_segments.interest_metrics table but not in the fresh_segments.interest_map table? What about the other way around?
SELECT
  COUNT(DISTINCT map.id) AS map_id_count,
  COUNT(DISTINCT metrics.interest_id) AS metrics_id_count,
  SUM(CASE WHEN map.id is NULL THEN 1 END) AS not_in_metric,
  SUM(CASE WHEN metrics.interest_id is NULL THEN 1 END) AS not_in_map
FROM fresh_segments.interest_map map
FULL OUTER JOIN fresh_segments.interest_metrics metrics
  ON metrics.interest_id = map.id;
- There are 1,209 unique
ids ininterest_map. - There are 1,202 unique
interest_ids ininterest_metrics. - There are no
interest_idthat did not appear ininterest_map. All 1,202 ids were present in theinterest_metricstable. - There are 7
ids that did not appear ininterest_metrics.
5. Summarise the id values in the fresh_segments.interest_map by its total record count in this table.
I found the solution for this question to be strange - hence I came up with another summary of the id values too.
Original solution:
SELECT COUNT(*)
FROM fresh_segments.interest_map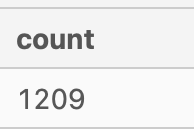
My solution:
SELECT
  id,
  interest_name,
  COUNT(*)
FROM fresh_segments.interest_map map
JOIN fresh_segments.interest_metrics metrics
  ON map.id = metrics.interest_id
GROUP BY id, interest_name
ORDER BY count DESC, id;
6. What sort of table join should we perform for our analysis and why? Check your logic by checking the rows where 'interest_id = 21246' in your joined output and include all columns from fresh_segments.interest_metrics and all columns from fresh_segments.interest_map except from the id column.
We should be using INNER JOIN to perform our analysis.
SELECT *
FROM fresh_segments.interest_map map
INNER JOIN fresh_segments.interest_metrics metrics
  ON map.id = metrics.interest_id
WHERE metrics.interest_id = 21246
  AND metrics._month IS NOT NULL; -- There were instances when interest_id is available, however the date values were not - hence filter them out.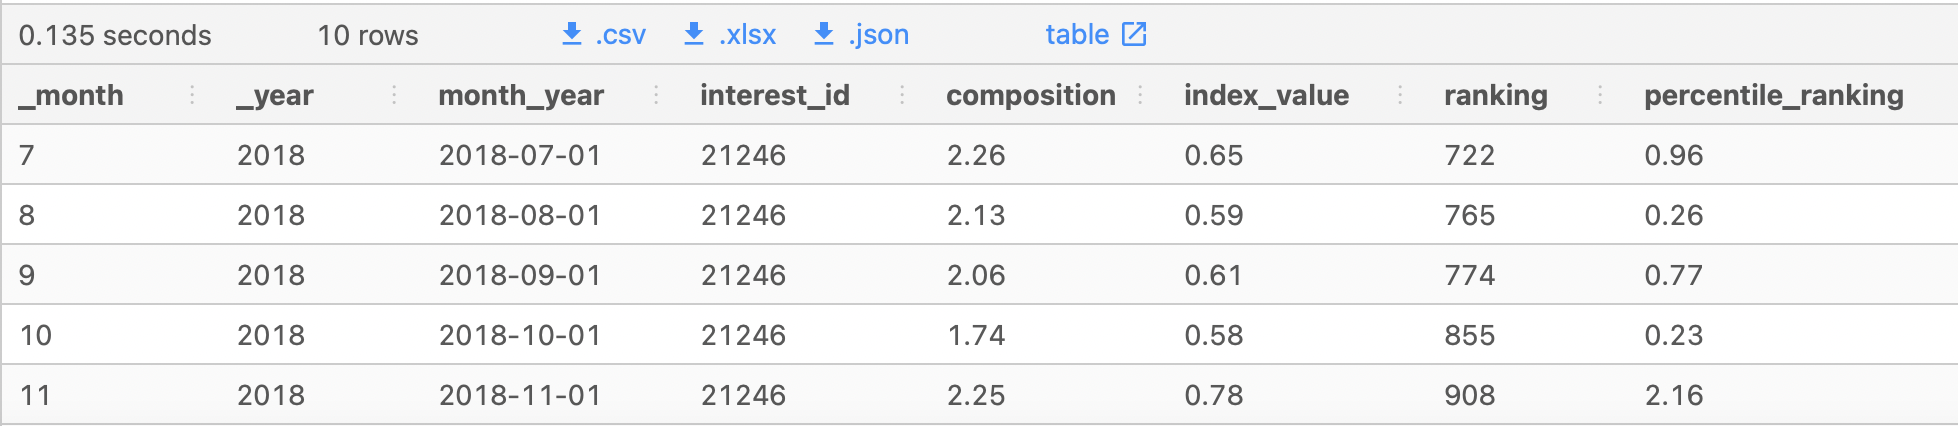
The results should come up to 10 rows only.
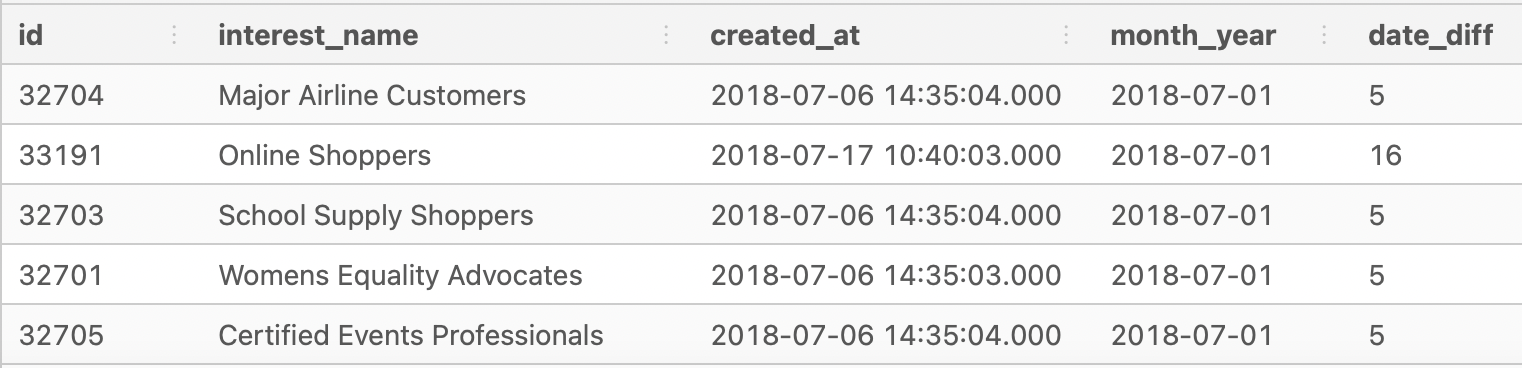
7. Are there any records in your joined table where the month_year value is before the created_at value from the fresh_segments.interest_map table? Do you think these values are valid and why?
SELECT
  COUNT(*)
FROM fresh_segments.interest_map map
INNER JOIN fresh_segments.interest_metrics metrics
  ON map.id = metrics.interest_id
WHERE metrics.month_year < map.created_at::DATE;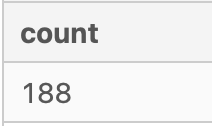
There are 188 records where the month_year date is before the created_at date.
However, it looks like these records are created in the same month as month_year. Do you remember that the month_year column's date is set to default on 1st day of the month?
Running another test to see whether date in month_year and created_at are in the same month.
SELECT
  COUNT(*)
FROM fresh_segments.interest_map map
INNER JOIN fresh_segments.interest_metrics metrics
  ON map.id = metrics.interest_id
WHERE metrics.month_year < DATE_TRUNC('mon', map.created_at::DATE);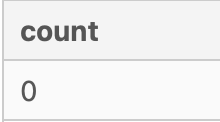
Seems like all the records' dates are in the same month, hence we will consider the records as valid.
1. Which interests have been present in all month_year dates in our dataset?
Find out how many unique month_year in dataset.
SELECT
  COUNT(DISTINCT month_year) AS unique_month_year_count,
  COUNT(DISTINCT interest_id) AS unique_interest_id_count
FROM fresh_segments.interest_metrics;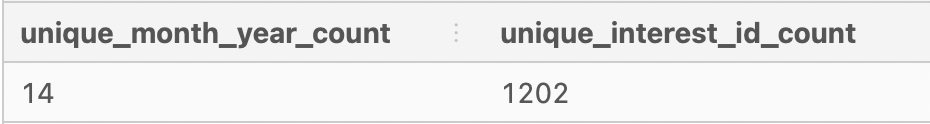
There are 14 distinct month_year dates and 1202 distinct interest_ids.
WITH interest_cte AS (
SELECT
  interest_id,
  COUNT(DISTINCT month_year) AS total_months
FROM fresh_segments.interest_metrics
WHERE month_year IS NOT NULL
GROUP BY interest_id
)

SELECT
  c.total_months,
  COUNT(DISTINCT c.interest_id)
FROM interest_cte c
WHERE total_months = 14
GROUP BY c.total_months
ORDER BY count DESC;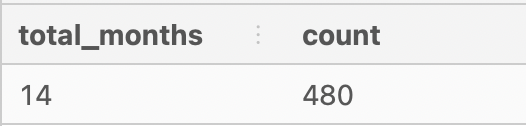
480 interests out of 1202 interests are present in all the month_year dates.
2. Using this same total_months measure - calculate the cumulative percentage of all records starting at 14 months - which total_months value passes the 90% cumulative percentage value?
Find out the point in which interests present in a particular number of months are not performing well. For example, interest id 101 only appeared in 6 months due to non or lack of clicks and interactions, so we can consider to cut the interest off.
WITH cte_interest_months AS (
SELECT
  interest_id,
  MAX(DISTINCT month_year) AS total_months
FROM fresh_segments.interest_metrics
WHERE interest_id IS NOT NULL
GROUP BY interest_id
),
cte_interest_counts AS (
  SELECT
    total_months,
    COUNT(DISTINCT interest_id) AS interest_count
  FROM cte_interest_months
  GROUP BY total_months
)

SELECT
  total_months,
  interest_count,
  ROUND(100 * SUM(interest_count) OVER (ORDER BY total_months DESC) / -- Create running total field using cumulative values of interest count
      (SUM(INTEREST_COUNT) OVER ()),2) AS cumulative_percentage
FROM cte_interest_counts;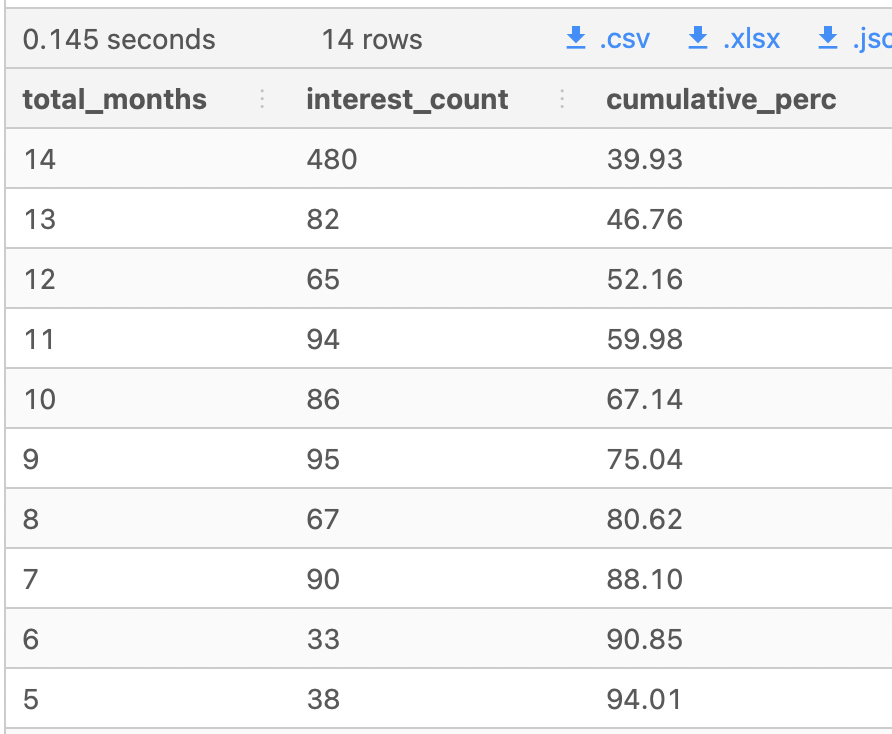
Interests with total months of 6 and above received a 90% and above percentage. Interests below this mark should be investigated to improve their clicks and customer interactions.
3. If we were to remove all interest_id values which are lower than the total_months value we found in the previous question - how many total data points would we be removing?
**4. Does this decision make sense to remove these data points from a business perspective? Use an example where there are all 14 months present to a removed interest example for your arguments - think about what it means to have less months present from a segment perspective. **
5. If we include all of our interests regardless of their counts - how many unique interests are there for each month?
- Using the complete dataset - which are the top 10 and bottom 10 interests which have the largest composition values in any month_year? Only use the maximum composition value for each interest but you must keep the corresponding month_year
- Which 5 interests had the lowest average ranking value?
- Which 5 interests had the largest standard deviation in their percentile_ranking value?
- For the 5 interests found in the previous question - what was minimum and maximum percentile_ranking values for each interest and its corresponding year_month value? Can you describe what is happening for these 5 interests?
- How would you describe our customers in this segment based off their composition and ranking values? What sort of products or services should we show to these customers and what should we avoid?
The index_value is a measure which can be used to reverse calculate the average composition for Fresh Segments’ clients. Average composition can be calculated by dividing the composition column by the index_value column rounded to 2 decimal places.
- What is the top 10 interests by the average composition for each month?
- For all of these top 10 interests - which interest appears the most often?
- What is the average of the average composition for the top 10 interests for each month?
- What is the 3 month rolling average of the max average composition value from September 2018 to August 2019 and include the previous top ranking interests in the same output shown below.
- Provide a possible reason why the max average composition might change from month to month? Could it signal something is not quite right with the overall business model for Fresh Segments?
Do give me a 🌟 if you like what you're reading. Thank you! 🙆🏻♀️